[Study authors: Adam Elga, Jian-Qiao Zhu, Thomas L. Griffiths]
Summary: When asked to divide a fixed budget to fight several independent existential risks, experimental participants did not allocate enough resources to the risks with lowest probability of survival.
Excerpts:
if we face catastrophes with survival probabilities of 4% and 40%, it is more valuable to increase the probability of surviving the first catastrophe from 4% to 9% than it is to increase the probability of surviving the second catastrophe from 40% to 80% (since we care about the product of the survival probabilities and 9% ⋅ 40% > 4% ⋅ 80%). This dependence of optimal allocations on baseline chances of survival is a distinctive and somewhat counterintuitive feature of situations in which incentives are multiplicative (Lewis et al., 2023; Lewis & Simmons, 2020). [Reference added 2025-08-24: Ord 2020, Appendix D]
But
on average people allocated resources more evenly among the risks than was optimal.
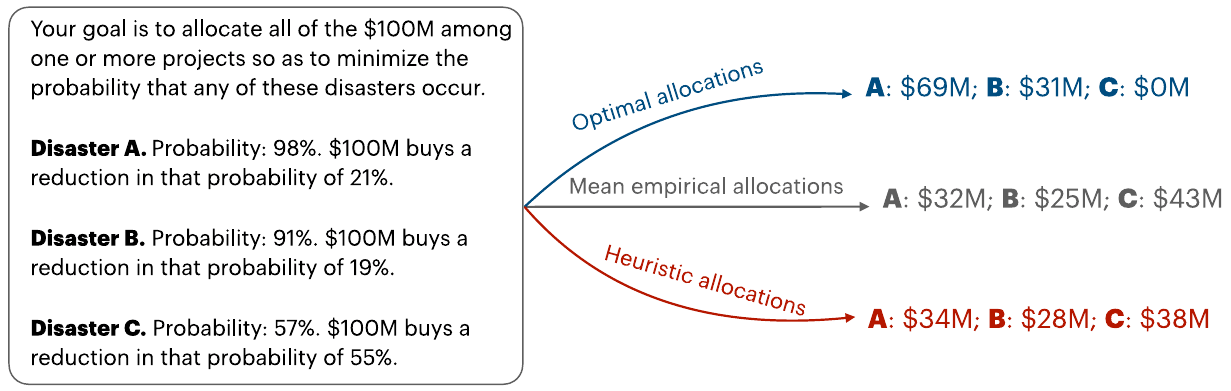

Figure legend: The optimal model (blue dots) compared with the mean normalized allocations made by participants (grey dots). Each vertex represents full investment in a given risk. Connecting lines indicate correspondence between model predictions and empirical data.
Conclusion excerpt (emphasis added):
our results suggest that an extremely natural and seemingly obvious practice – presenting risk mitigation options individually for comparison – is suboptimal. Put bluntly: while people are relatively good at choosing individual items for their grocery carts given each item’s price per ounce (a linear allocation problem), people are less good at the nonlinear allocation problem of choosing individual existential risk interventions based on each intervention’s risk reduction per dollar spent. As a result, it may be better to instead present decision makers with competing total allocation profiles (specifying how much is to be invested in each risk), where each profile is explicitly labeled with its estimated reduction in overall existential risk (the risk that any catastrophe occurs).
Interesting piece! Good to see you on the forum, Prof. Elga -- I've read a lot of your work!
Thanks!
Thanks for the post, and welcome to the EA Forum, Adam!
The initial probability of survival in your example is (1 - 0.98)*(1 - 0.91)*(1 - 0.57) = 0.0774 %, which is pretty low[1]. In contrast, I think the probability of surviving human extinction nearterm is close to 100 %, with all potential causes being very unlikely to lead to it. So I would estimate the increase in the probability of surviving human extinction adding the decrease in the probability of each potential cause (because the other terms with multiple factors are much smaller). For example, "decrease in the probability of A" + "decrease in the probability of B" + "decrease in the probability of C", which is a linear allocation. As a result, neglecting diminishing returns decreasing each risk in isolation (as I think you assume), I would decrease the risk of human extinction spending all the money decreasing the risk for which "reduction in the risk of human extinction in pp"/"cost" is the highest.
So low that it is unclear one should try to avoid the catastrophes?
Thanks, Vasco. I agree with your nice point that when all risks are very close to zero, the counterintuitive phenomenon we talk about in the paper makes very little difference. (Toby Ord also notes this in The Precipice (Appendix D).)
Thanks, Adam. The risks do not even have to be very close to 0. 10 % is enough. For 2 risks r1 and r2, the probability of survival is p_s_i = (1 - r1)*(1 - r2). If the risks change by Delta_r1 and Delta_r2, the probability of survival becomes p_s_f = (1 - r1 - Delta_r1)*(1 - r2 - Delta_r2) = p_s - (1 - r2)*Delta_r1 - (1 - r1)*Delta_r2 + Delta_r1*Delta_r2. So the increase in the probability of survival is Delta_p_s = p_s_f - p_s_i = -(1 - r2)*Delta_r1 - (1 - r1)*Delta_r2 + Delta_r1*Delta_r2. If both risks are at most 10 %, which I would say very much holds in reality, 1 - r1 and 1 - r2 are roughly 1. In addition, for relatively small allocations of money, the last term is negligible. So the increase in the probability of survival is approximately -Delta_r1 - Delta_r2, which is the sum of the decreases in risks 1 and 2.
I like your idea of doing a back-of-the-envelope calculation assuming that there are just two risks. Suppose that risk #1 has survival probability s1 and risk #2 has survival probability s2. Assume s1 < s2. Let's compare two alternative interventions:
Now we have:
So the increase in overall survival probability produced by intervention #1 is 100 * (s2/s1 - 1) percent greater than the increase in overall survival probability produced by intervention #2.
Plugging in some toy numbers:
So a risk's base survival probability does make some difference to how much one increases overall survival probability by mitigating that risk. But overall I agree with you that for risks with survival probability greater than 90%, the difference is modest.
Thanks for the elaboration, Adam! That makes sense.