Summary
- Overall satisfaction with the EA community remains high (7.11/10).
- Satisfaction is slightly (though non-significantly) lower than in 2020 (7.26) and 2022 (7.16).
- People who joined EA more recently report higher satisfaction than those who joined earlier.
- Respondents identifying as men report higher satisfaction (7.24) than those who do not (6.88).
- There were no significant differences in satisfaction based on racial identity.
- Highly engaged individuals report higher satisfaction (7.33) than less engaged respondents (6.70).
- People’s reported likelihood to stay in the community was high overall. On a 7-point scale, the mean likelihood to remain involved in 3 years was 5.52.
- Means vary modestly by year first involved.
- Self-identified men expressed marginally higher retention intentions (5.58 vs 5.41).
- There were no significant differences based on racial identity.
- Retention intentions were higher among highly engaged respondents (5.71) than those reporting to be less engaged (5.27).
- EA’s reported impact on mental health is mixed, with more increases than decreases.
- There are no significant differences in reported mental health scores by gender.
- Non-white respondents report slightly higher mean mental-health scores than White respondents.
- Engagement: Highly engaged respondents are more polarised (more likely to report both increases and decreases in mental health), while Low engagement respondents are more likely to report that their mental health was unchanged.
Introduction
In this post, we report on a number of questions about people’s satisfaction with the EA community, their likelihood of remaining in EA, and EA’s impact on their mental health.
Satisfaction
Looking at the graph and data for community satisfaction, we find that respondents reported being generally satisfied with the EA community, indicated by an average score of 7.11 (SD = 1.73) on a 10-point scale. The median satisfaction was 7, and around 47% reported a satisfaction of 8 or higher, resulting in a left-skewed distribution.
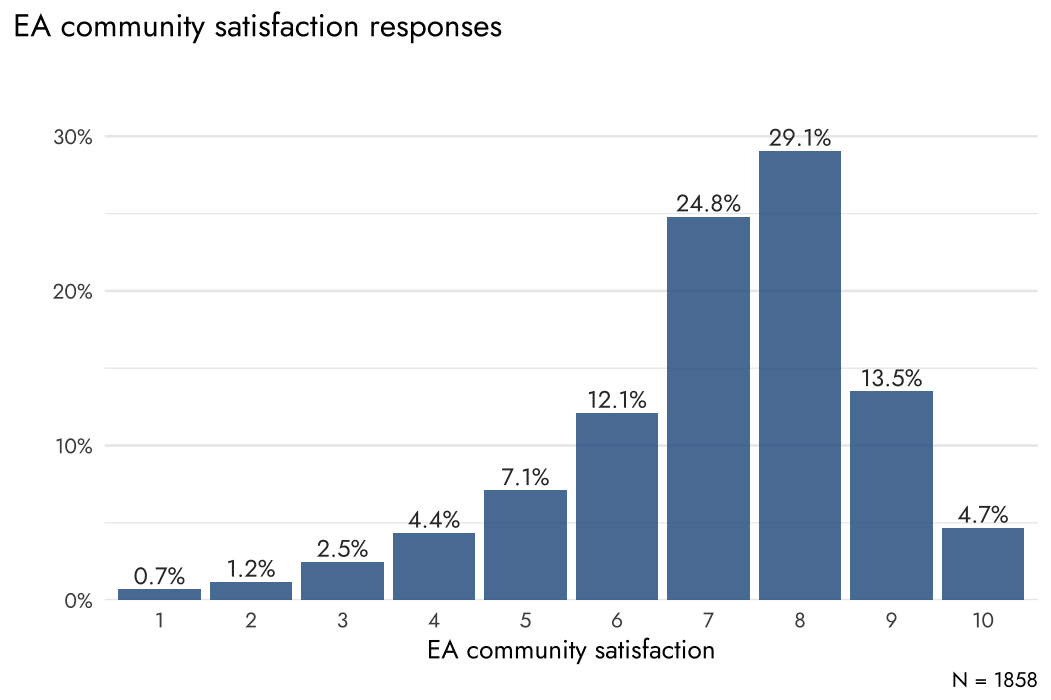
Figure 1. EA community satisfaction responses (2024). Bars show the percentage of respondents selecting each value on a 1–10 scale.
Satisfaction scores have declined slightly since 2020, though the difference is not significant: mean scores were 7.26 (95% CI [7.17, 7.34]) in 2020, 7.16 (95% CI [7.10, 7.22]) in 2022 and 7.11 (95% CI [7.03, 7.34]) in 2024.
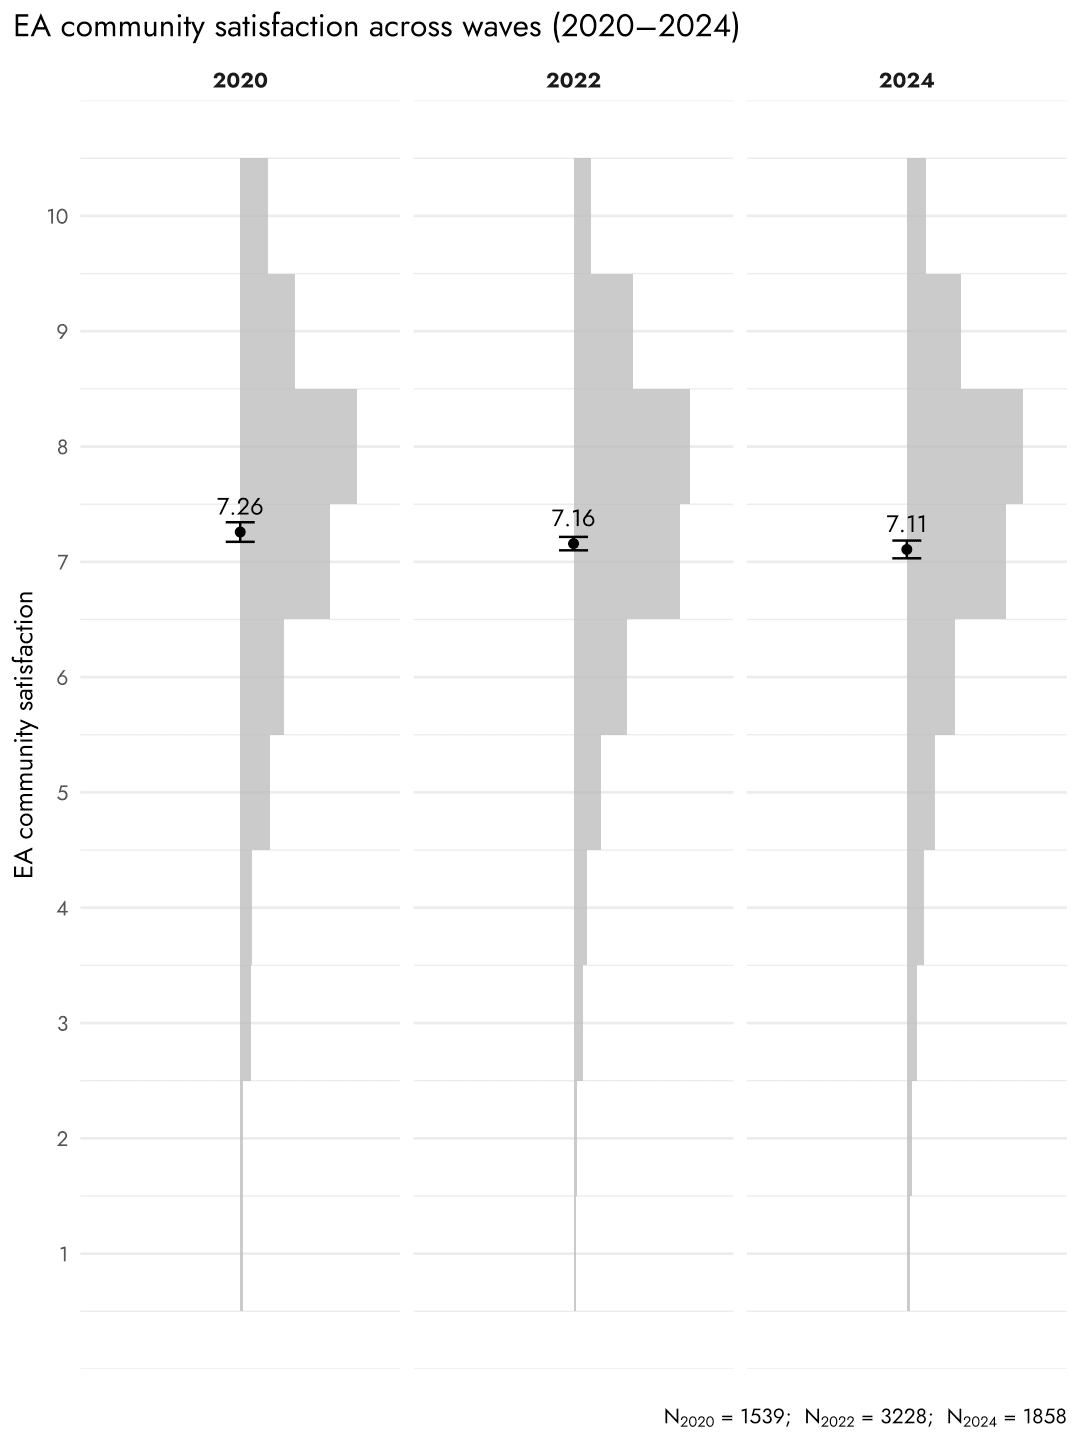
Figure 2. Satisfaction across survey waves (2020–2024). Histograms show the distribution of satisfaction scores in 2020, 2022 and 2024. Points denote cohort means; error bars reflect 95% CI.
Cohort
Satisfaction tends to increase with more recent entry into EA. Respondents who became involved before 2010 averaged 6.25 (SD = 2.29), while those first involved in 2024 averaged 7.55 (SD = 1.65).
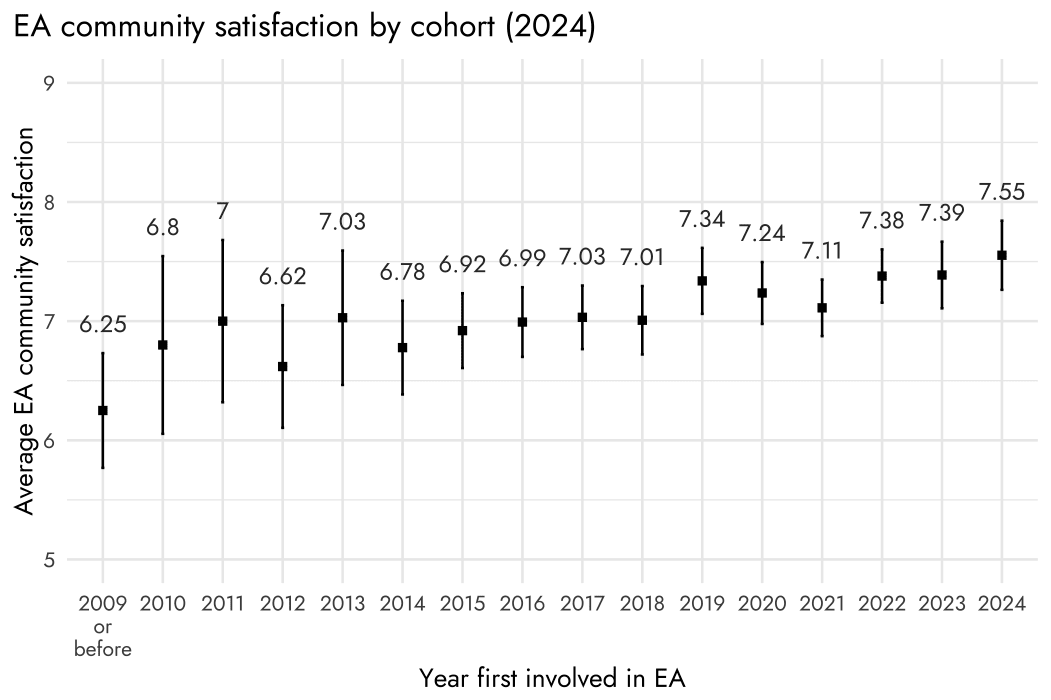
Figure 3. EA community satisfaction by cohort (2024). Points denote cohort means; error bars reflect 95 % confidence intervals.
Gender
Respondents who self-described themselves as male reported a mean satisfaction of 7.24 (95% CI [7.15, 7.33]), while respondents who did not self-describe as “male” reported 6.88 (95% CI [6.73, 7.02]). A statistically significant mean difference of 0.37 points (p < .001).
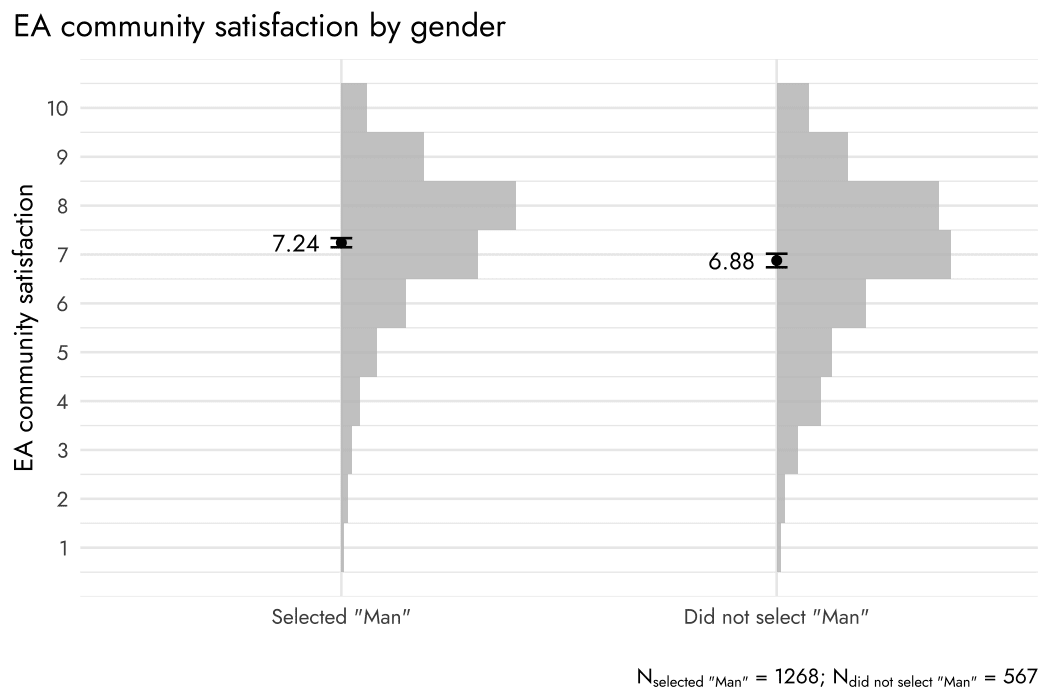
Figure 4. EA community satisfaction by gender. Histograms show the distribution of satisfaction scores for those who selected “Man” versus those who did not. Points denote means; error bars reflect 95 % CI.
Race
Identical to the previous report, we did not observe significant differences in satisfaction between white and non‑white respondents (M = 7.13, 95% CI [7.04, 7.22]; M = 7.22, 95% CI [7.06, 7.38], respectively).
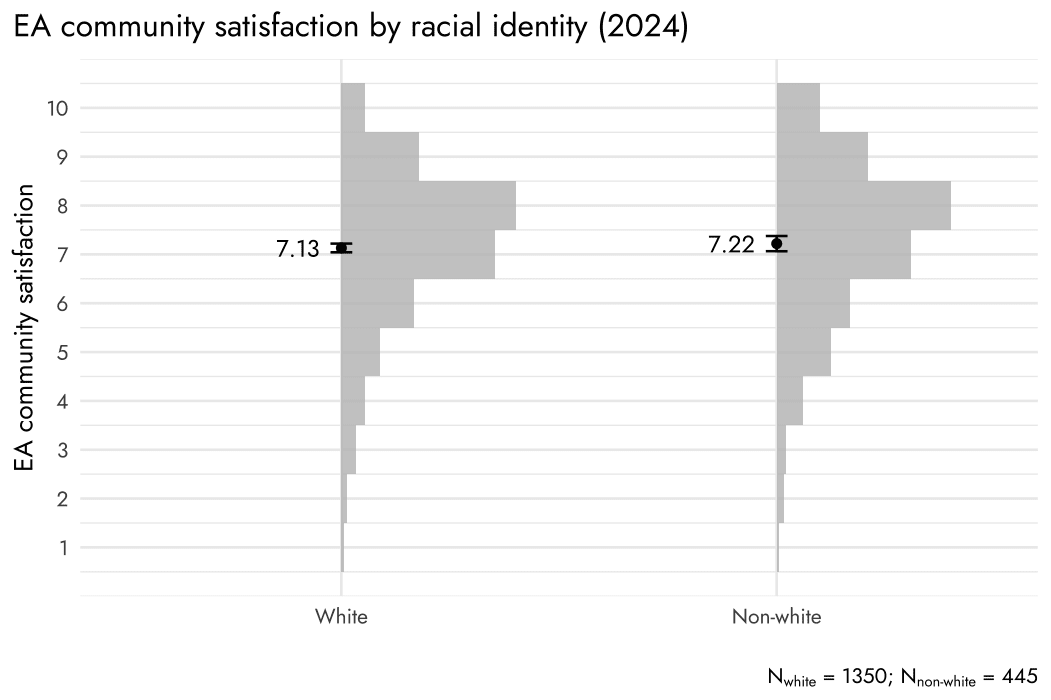
Figure 5. EA community satisfaction by racial identity (2024). Histograms show the distribution of satisfaction scores for those identifying as white versus not. Points denote means; error bars reflect 95 % CI.
Engagement
One intuitive finding, aligned with previous reports, was that respondents who reported being highly engaged (M = 7.33, 95% CI [7.23, 7.43]) also reported significantly higher levels of satisfaction than respondents who reported low engagement (M = 6.83, 95% CI [6.70, 6.95]); a mean difference of 0.50 (p < .001).
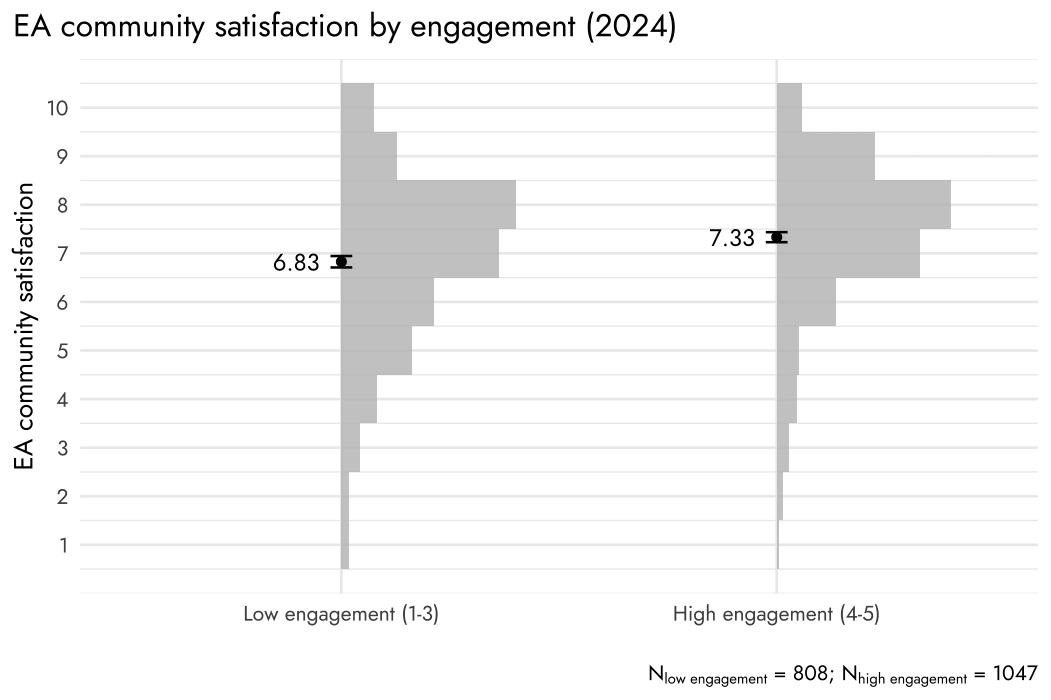
Figure 6. EA community satisfaction by engagement (2024). Histograms show the distribution of satisfaction scores for those reporting high engagement versus low engagement. Points denote means; error bars reflect 95 % CI.
1.3.4 Correlations with cause priorities & regression results
For each of the cause areas, respondents were asked to indicate how much each cause should be prioritized by EAs. For most causes, we find that when a respondent rates a cause as a higher priority, their average community satisfaction rises. This general trend could be explained by response bias (e.g., people are more inclined to give negative responses to one question are more likely to give negative responses to another). Or it could be that lower satisfaction with EA causes is associated with lower satisfaction with the community. The positive association between cause ratings and satisfaction is strongest for EA movement building and AI risk. Biosecurity, nuclear security, animal welfare, and other x-risks also climb, then plateau at the highest priority levels. For Global poverty & health satisfaction, the highest levels are found at mid-level priorities, and then they drop back down. Climate change and mental health are largely flat with a slight negative trend. This fits a pattern we have observed in previous reports: higher support for longtermist causes is associated with higher satisfaction, while higher support for neartermist causes is associated with lower satisfaction.
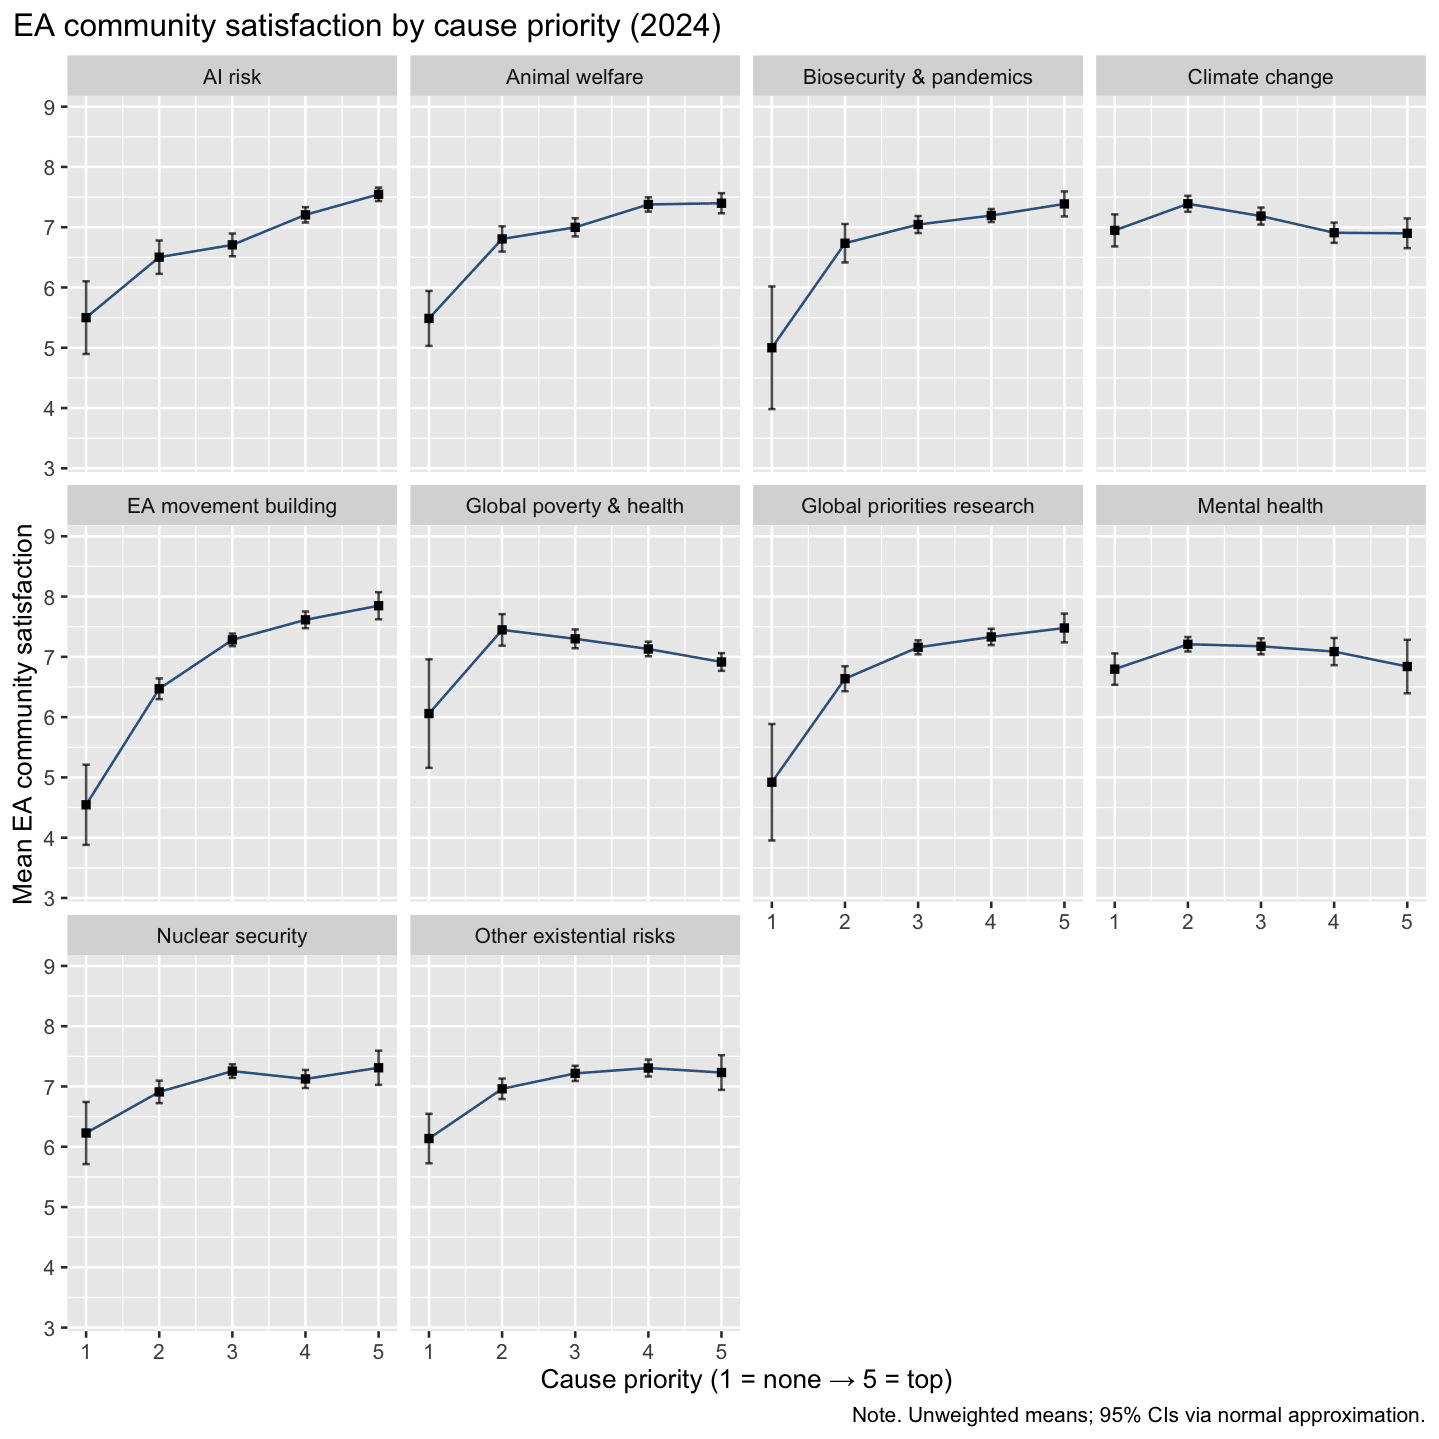
Figure 7. Satisfaction by cause priority (2024). Each panel plots mean satisfaction against 1–5 cause priority ratings with 95 % CIs.
For robustness, we conducted a multiple regression analysis to assess whether previously found differences hold when controlling for relevant covariates. When including all variables found below, our model shows that all previously mentioned group differences are robust when controlling for these covariates. Additionally, we found that age and coming from the US negatively predicted satisfaction.
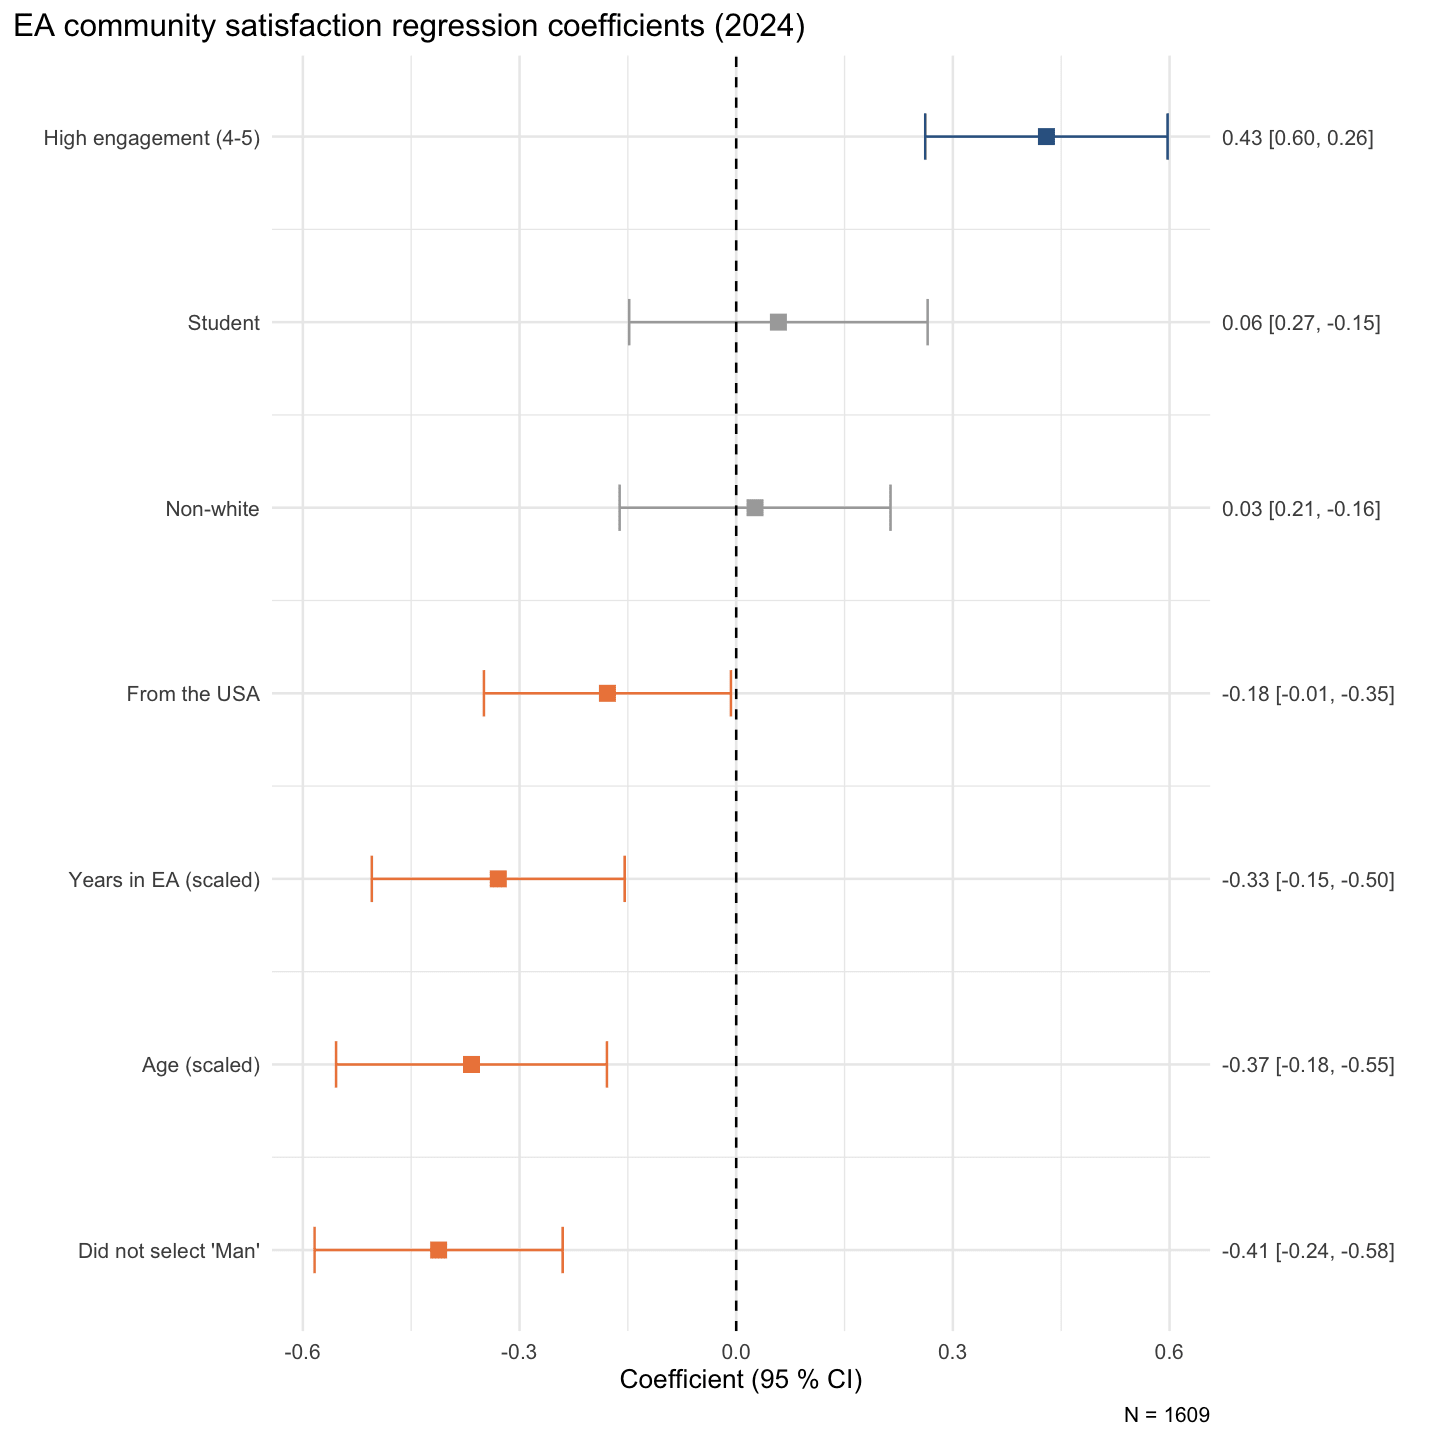
Figure 8. EA community satisfaction regression coefficients (2024). Points denote coefficient estimates; bars show 95 % CIs.
Retention
Respondents were asked “Assuming the EA community still exists in a form roughly similar to how it is now, how likely do you think you are to still be involved in the EA community in three years' time?” Response options were on a 1–7 scale ((1) Impossible (7) Certain), though none selected the ‘Impossible’ option. Retention responses cluster towards the upper end. When binned into three categories—Unlikely (1–2), Even odds (3) and Likely to remain (4–6)—the vast majority (85.9 %) fall into the “Likely” group, 9.4 % into “Even odds” and only 4.7 % into “Unlikely”. Of course, it’s important to bear in mind that these results reflect only responses from those who have remained in the community and not already dropped out, so the community’s overall retention situation could be less sanguine than these results suggest.
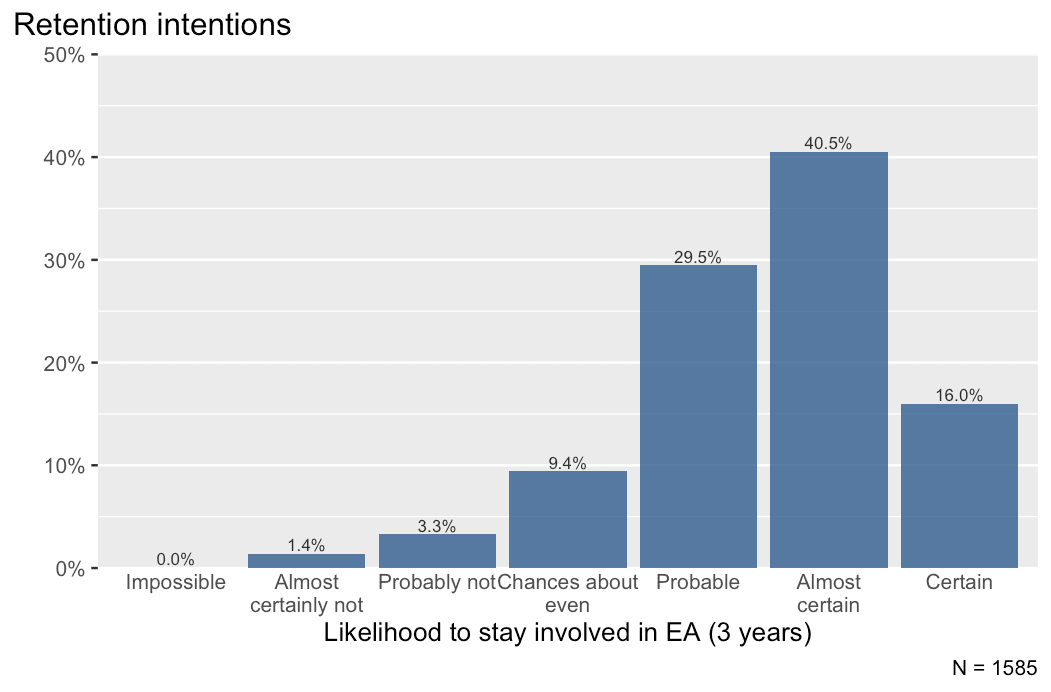
Figure 9. Retention intentions. Bars show percentages selecting each category on the 1–7 retention scale.
Cohort
Unlike satisfaction, we do not find a clear time trend or striking differences between cohorts when looking at their reported likelihood to be involved in EA in 3 years’ time.
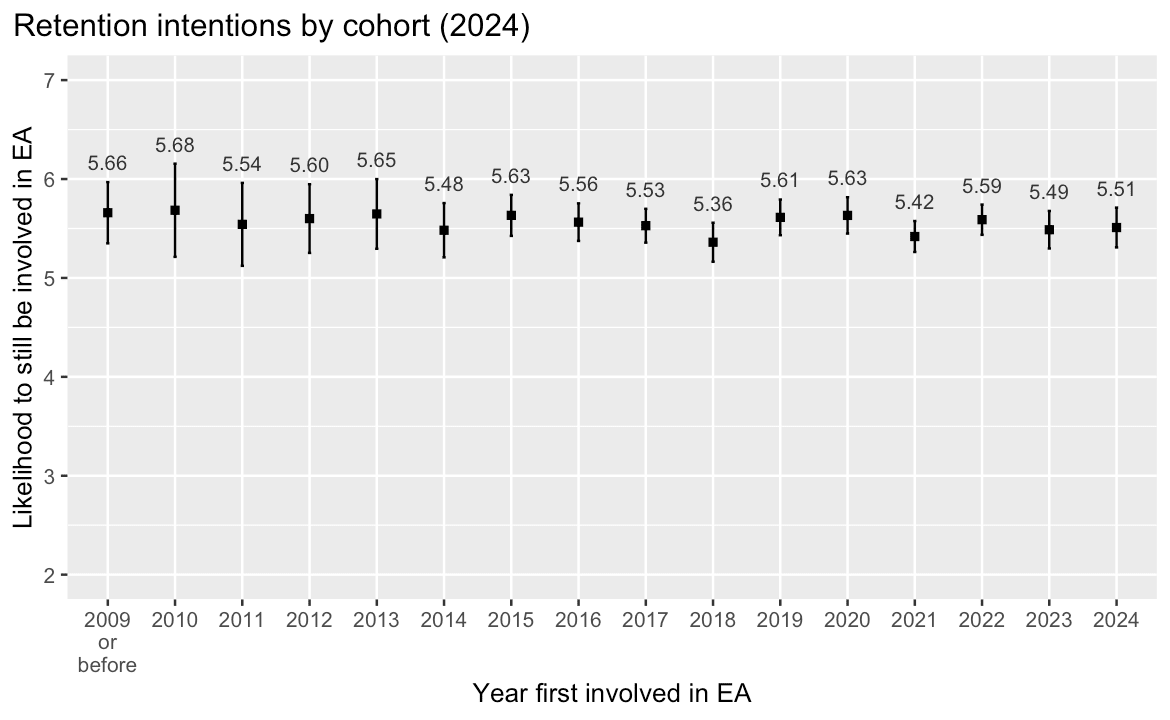
Figure 10. Retention intentions by cohort (2024). Points denote cohort means; error bars show 95 % confidence intervals.
Gender
Respondents identifying as a man reported mean retention of 5.58 (95% CI [5.52, 5.64]) versus 5.41 (95% CI [5.31, 5.51]) among other respondents. The difference is statistically significant (mean difference = 0.17, p = .0036).
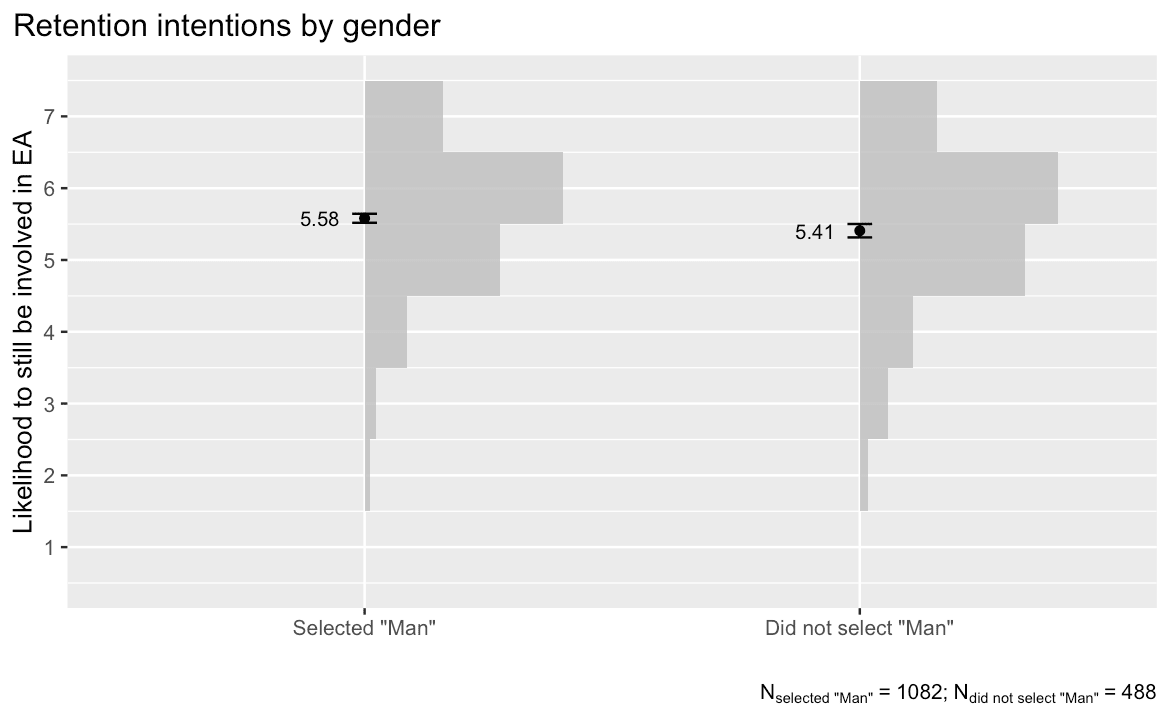
Figure 11. Retention intentions by gender. Histograms show the distribution of satisfaction scores for those selecting “Man” versus not. Points denote means; error bars reflect 95 % CI.
Race
White and non‑white respondents had virtually identical retention means (M = 5.53, 95% CI [5.47, 5.59]; M = 5.54, 95% CI [5.43, 5.65], respectively).

Figure 12. Retention intentions by racial identity (2024). Histograms show the distribution of satisfaction scores for those identifying as white versus non-white. Points denote means; error bars reflect 95 % CI.
Engagement
Similar to the satisfaction scores, there was a significant difference in the self-reported likelihood to be involved in EA between highly-engaged respondents (M = 5.71, 95% CI [5.65, 4.77]) and less-engaged respondents (M = 5.27, 95% CI [5.19, 5.36])– a difference in means of 0.44 on a 7-point scale.
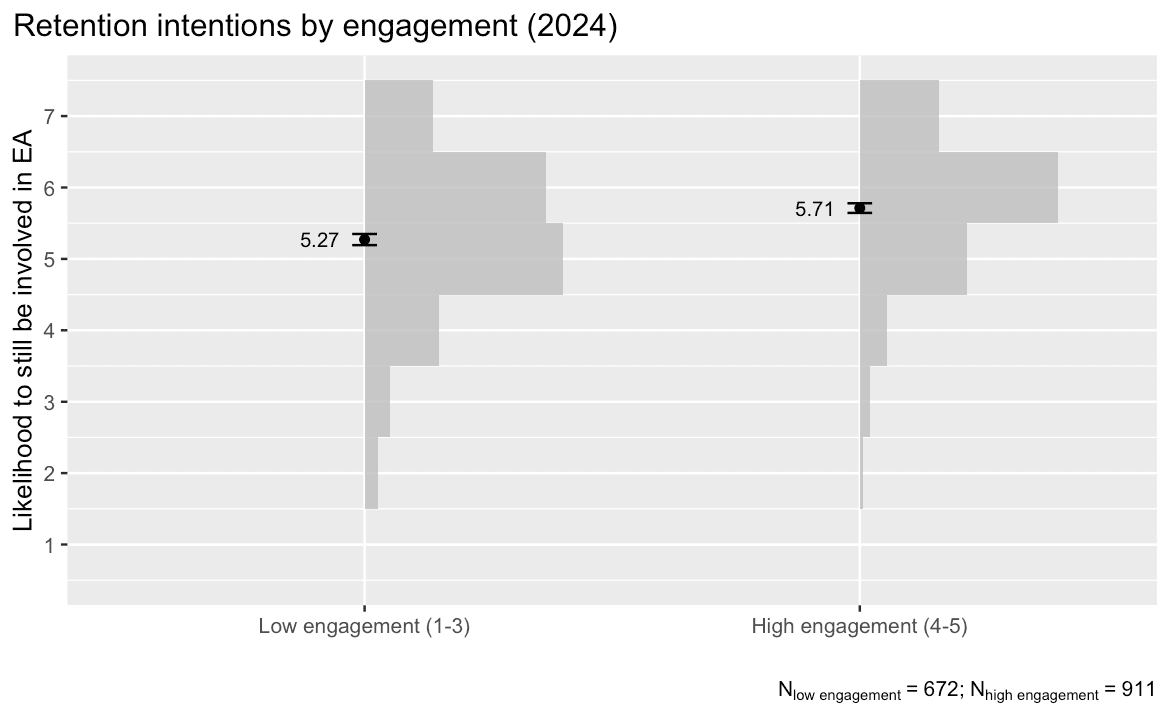
Figure 13. Retention intentions by engagement (2024). Histograms show the distribution of satisfaction scores for those reporting high engagement versus low engagement. Points denote means; error bars reflect 95 % CI.
1.4.5 Correlations with cause priorities & regression results
Across causes, retention intentions vary little by stated priority. Most panels show near-horizontal trends, with changes typically well below half a point on the 6-point scale and overlapping CIs across adjacent levels. One exception stands out: EA movement building shows a clear monotonic increase. A similar trend, albeit a little less intense, can be found for animal welfare and global priorities research. Mental health, AI risk, biosecurity, nuclear security, global poverty & health, and other x-risks are largely flat after an initial slight rise, while climate change exerts a negative trend. Overall, differences by cause priority are small in magnitude.
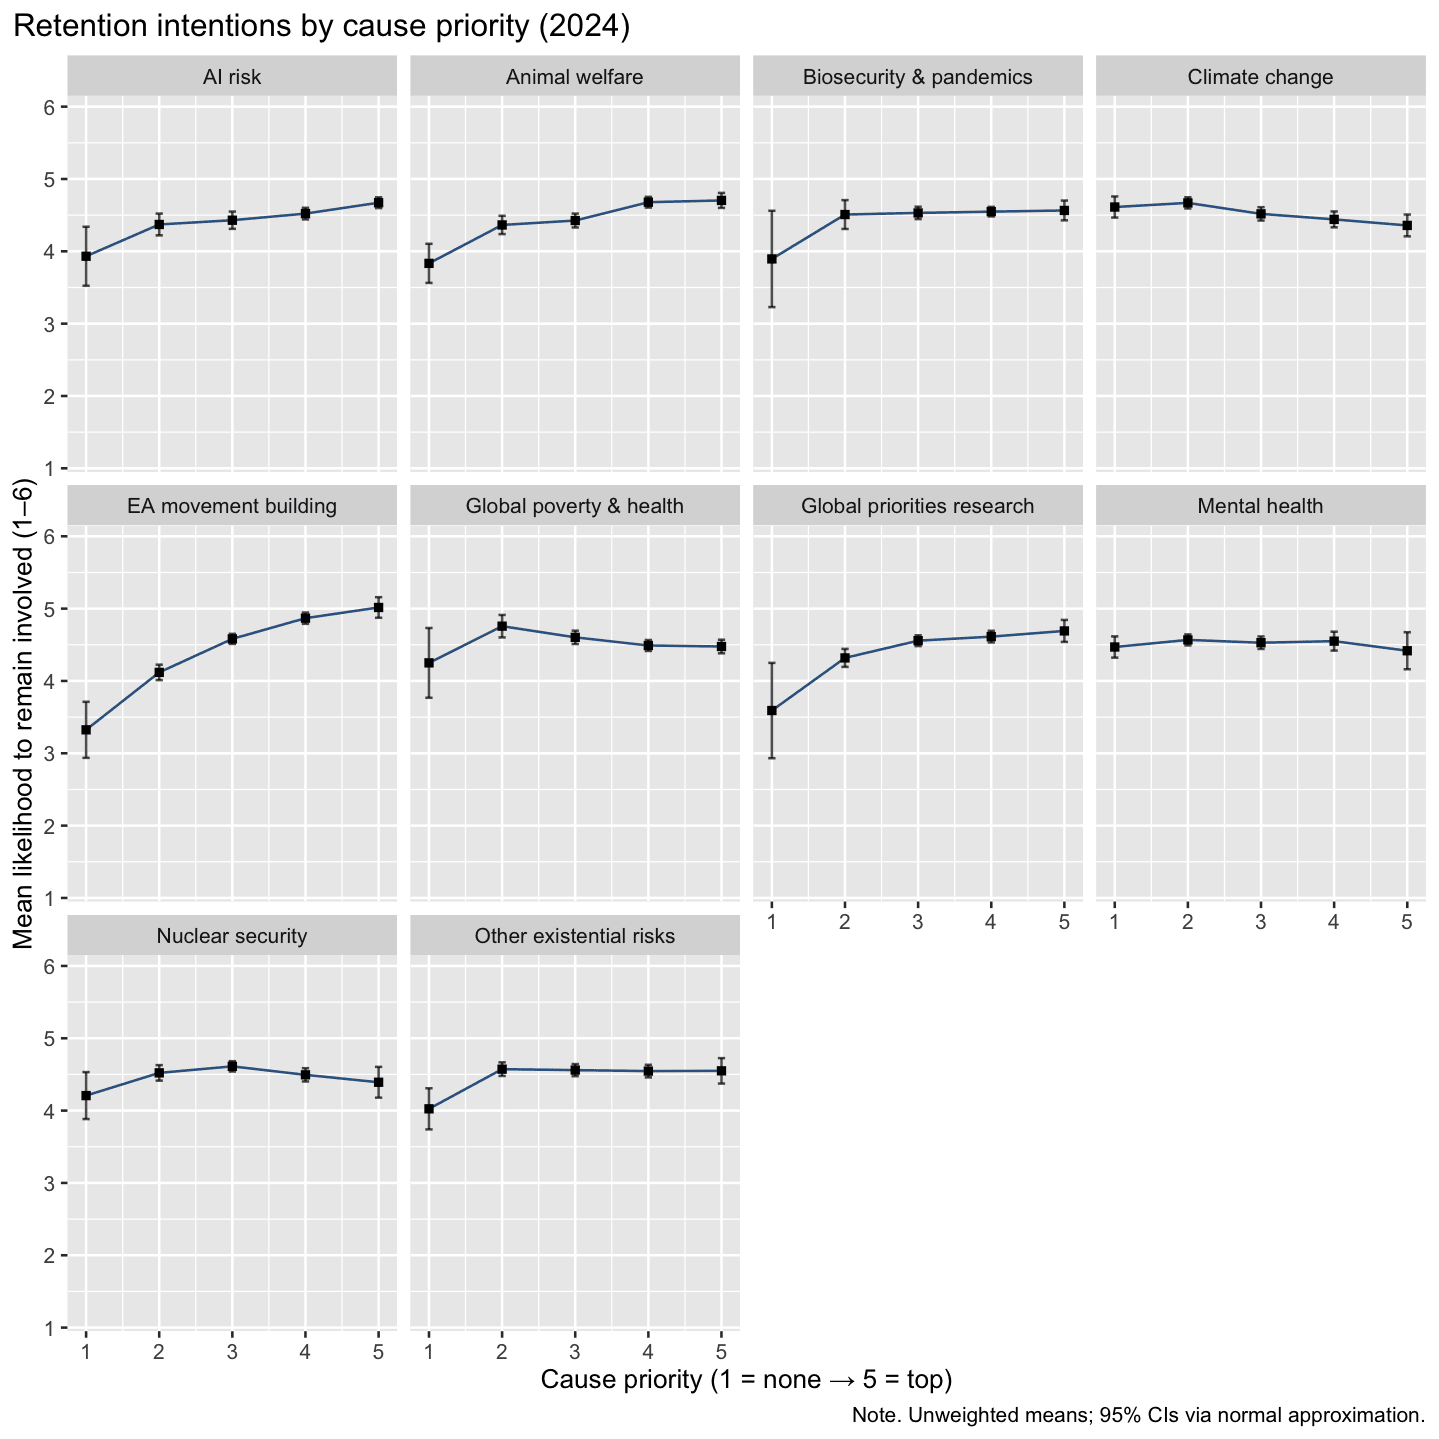
Figure 14. Retention intentions by cause priority (2024). Each panel plots mean satisfaction against 1–5 cause priority ratings with 95 % CIs.
After controlling for relevant covariates, regression analysis showed that the significant group differences reported above remained significant (engagement and gender).
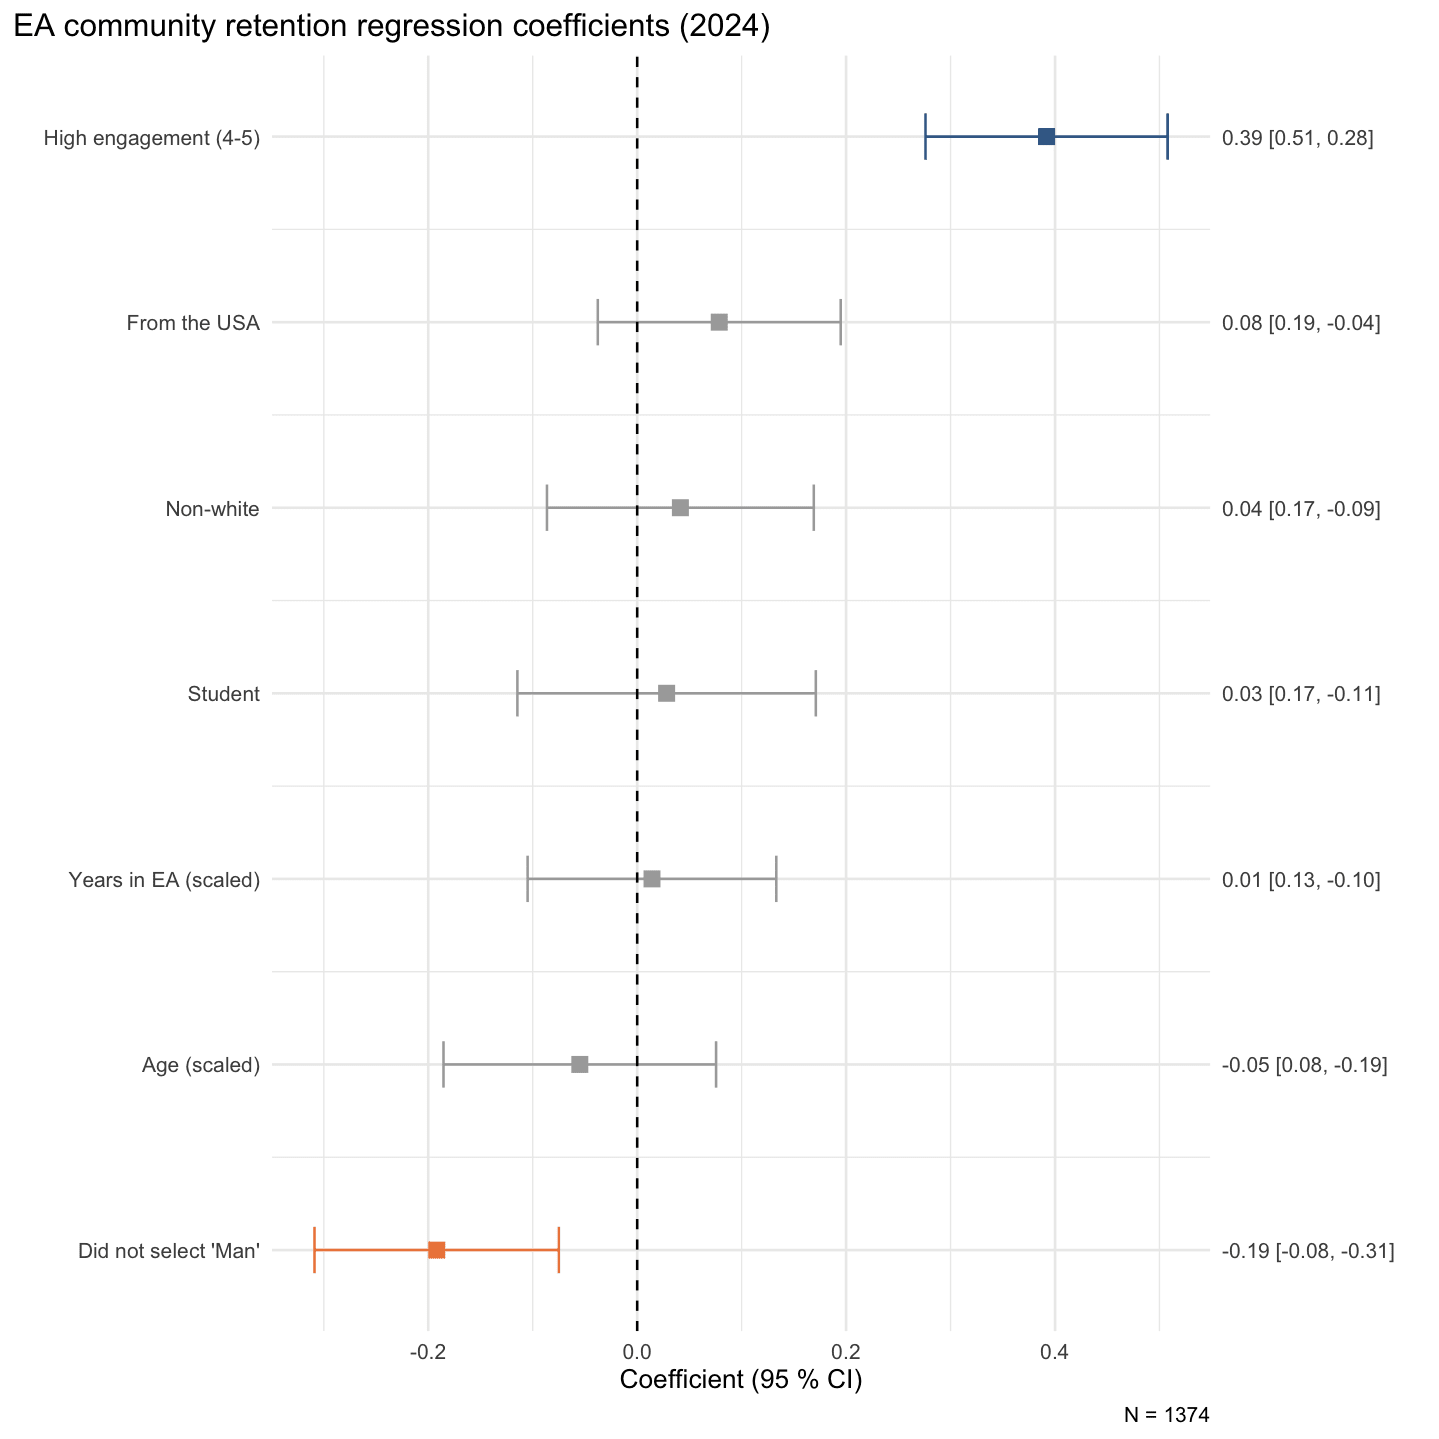
Figure 15. EA community retention regression coefficients (2024). Points denote coefficient estimates; bars show 95 % CIs.
Mental Health
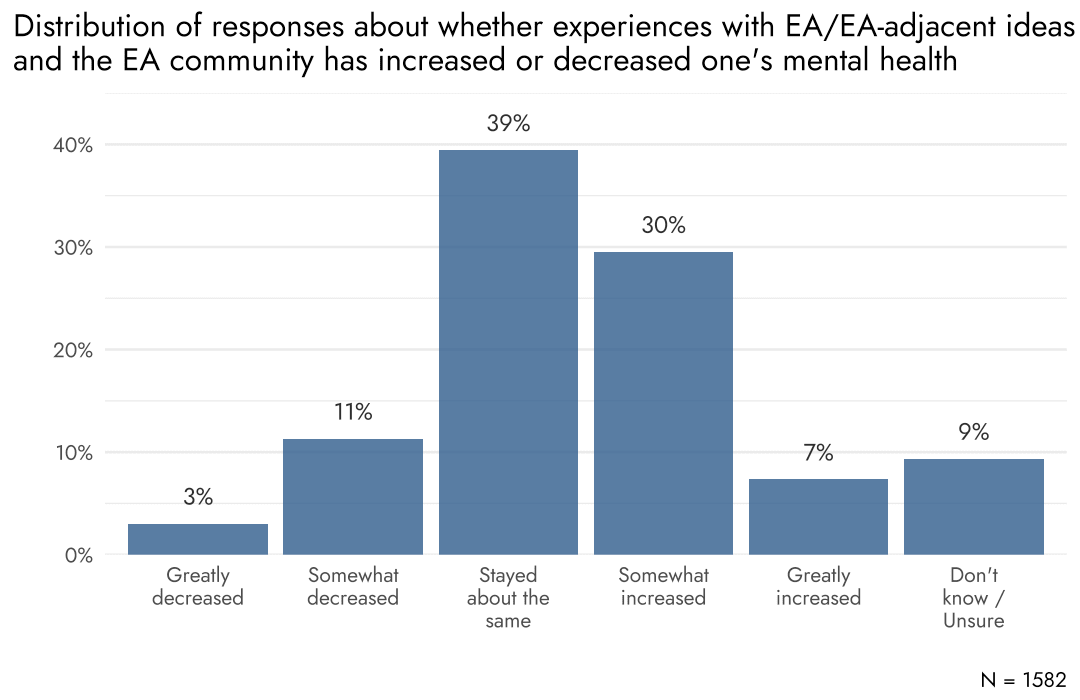
We asked respondents whether experiences with EA/EA-adjacent ideas and the EA community had increased or decreased their mental health. Most commonly, respondents reported that their mental health stayed about the same (39.4 %), followed by 29.5% reporting that their experiences somewhat increased their mental health. 11 % reported decreases and only 3% reported that their mental health had greatly decreased.
For interpretability, responses were collapsed into four buckets: Decreased (1-2), Same (3), Increased (4-5), and Don’t know (6). The collapsed distribution was 14.3 % decreased, 39.4 % same, 36.9 % increased, and 9.4 % unsure.
Gender
Collapsed percentages show men and others reported similar mental‑health outcomes. Those who did not select “Man” were slightly more likely to report decreases (16% vs 13.5%) and uncertainty (11.7% vs 8.3%) and slightly less likely to say their mental health stayed about the same (36.3% vs 41.0%). However, examining the fine-grained response categories, we do observe a higher percentage among those who did not select “Man” reporting that their mental health greatly increased (10.0% vs 6.0%). Mean mental‑health scores (1–5, excluding “Don’t know”), however, did not differ significantly (Mselected Man = 3.29, 95% CI [3.24, 3.35]vs Mdid not select man = 3.31, 95% CI [3.21, 3.40]; p = .78).[1]
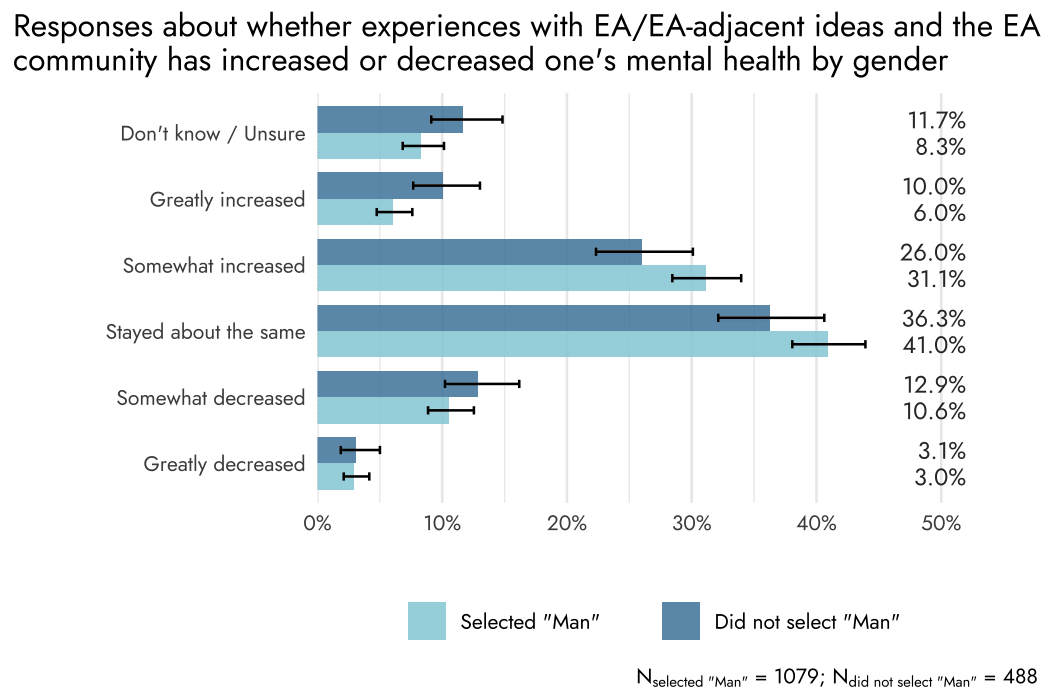
Figure 17. Mental‑health outcomes by gender. Error bars denote 95 % CIs.
Engagement
High‑engagement respondents were more polarised: they were more likely than low‑engagement participants to report both decreases (18.3% vs 8.9%) and increases (39.9% vs 32.9%), and less likely to say their mental health stayed the same (33.5% vs 47.5%). This makes sense as individuals with higher engagement with the community might be expected to be more affected by it. However, average mental‑health scores did not differ significantly (MLow Engagement = 3.3, 95% CI [3.25, 3.37] vs MHigh Engagement = 3.29, 95% CI [3.22, 3.36]; p = .62).

Figure 18. Mental‑health outcomes by engagement level. Error bars denote 95 % CIs.
Racial Identity
Non‑white respondents were more likely to report increases in mental health (40.8% vs 35.9%) and less likely to report decreases (10.6% vs 15.6%). Mean mental‑health scores were higher among Non‑white respondents (MNon-white = 3.41, 95% CI [3.31, 3.50] vs MWhite = 3.26, 95% CI [3.21, 3.31]; p = .009).
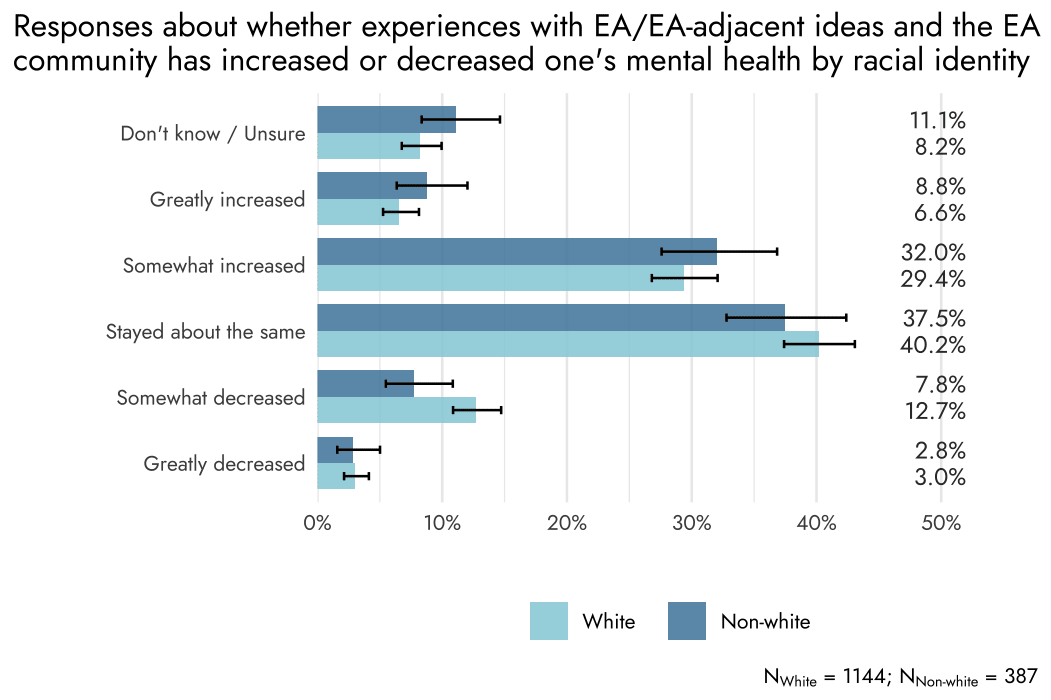
Figure 19. Mental‑health outcomes by racial identity. Error bars denote 95 % CIs.
Conclusion
Overall, reported levels of community satisfaction remain relatively steady, and high in absolute terms.
Differences across groups likewise remain relatively consistent with previous years. For example, we observe that respondents who did not identify as a “Man” reported lower satisfaction than those who did, to almost exactly the same extent as last year. The reported likelihood of remaining in EA was also marginally, though statistically significantly, lower. Understanding these differences would warrant further investigation.
Appendix
Comfort Sharing EA with a friend
By request, we also included two exploratory measures concerning people’s willingness to share EA with others.
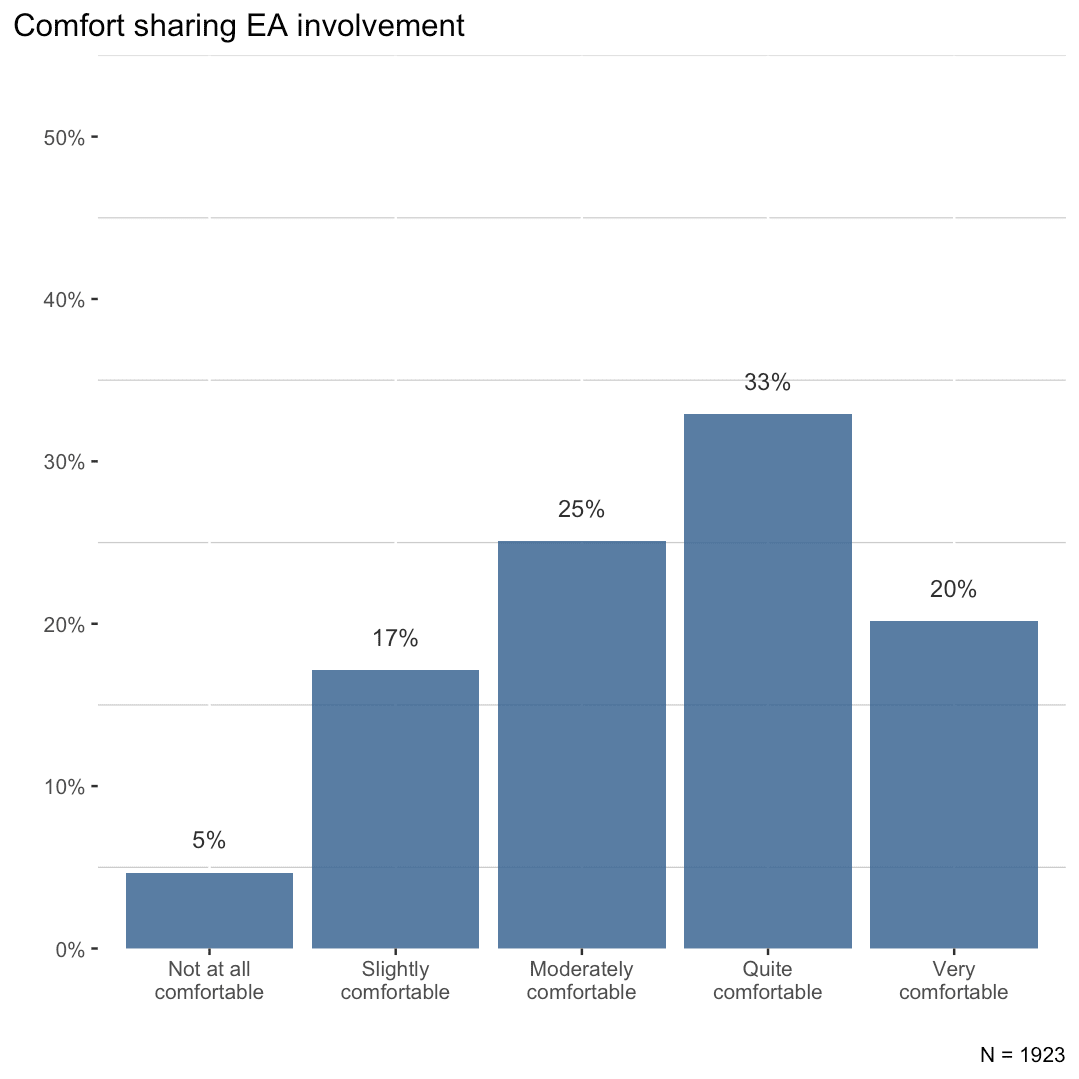
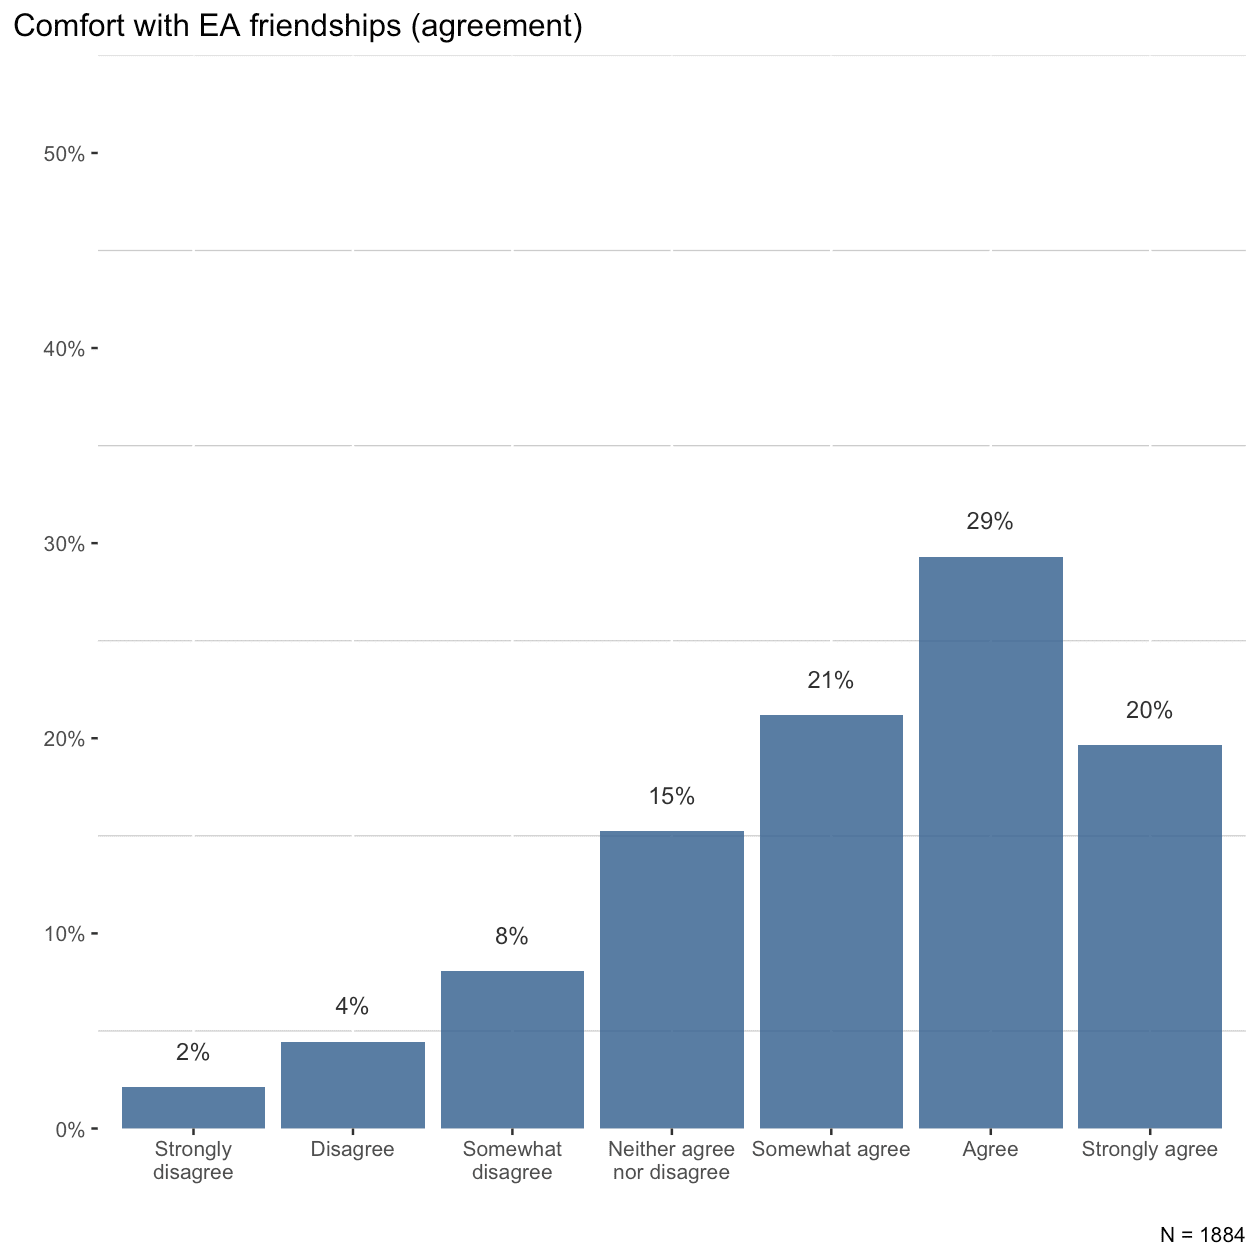
The first asked “How comfortable do you feel telling others about your involvement with EA?” (1) Not at all comfortable - (5) Very comfortable. The second asked respondents to what extent they agreed or disagreed with the statement “I would feel comfortable bringing a friend to EA spaces.” (1) Strongly disagree - (7) Strongly agree.
When asked about sharing their involvement with EA, responses tended to be reasonably high, with 53% above the midpoint.
When asked about their comfort bringing a friend to the EA space, responses again tended to be strongly positive, with 70% above the midpoint.
Acknowledgments

Written by Niklas Fritsche, with contributions from David Moss. Thanks to Jamie Elsey, Laura Duffy for review.
- ^
Welch’s two-sample t-test.